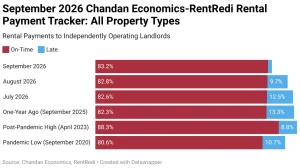
The September increase extends a two-month rebound from the summer trough and brings the national rate back to roughly its June level. While month-to-month performance remains somewhat uneven, the latest readings suggest that the sharp deterioration seen through much of 2025 has given way to a more stable pattern in 2026.
The year-over-year comparison has also become more favorable. September’s on-time payment rate stood 91 basis points above September 2025, reinforcing the view that collection conditions have improved meaningfully from the lows reached late last year.
As in prior months, first estimates remain subject to modest revision as additional payment data are incorporated. August’s on-time payment rate, initially estimated at 83.2%, was subsequently revised to 82.8%. These revisions reflect normal reconciliation and do not materially alter the broader stabilization trend.
Year-over-year payment performance strengthened further in September. On-time collections were 91 basis points above September 2025, up from a 48-basis-point annual gain in August and marking the strongest year-over-year improvement since May 2023.
The shift is significant relative to where the sector stood less than a year ago. Annual declines exceeded 300 basis points during parts of late 2025 and early 2026, but those losses have now been fully reversed. The latest data suggest that the market has moved beyond the prolonged deterioration that defined much of the prior two years and into a more stable phase.
Even so, current on-time payment rates remain below earlier-cycle highs. The improvement is better characterized as a recovery from recent weakness than a return to the collection performance seen in 2022 and 2023.
Full-Payment Rate: Historical & Forecast
The forecast full-payment rate for September 2026 — which accounts for on-time, late, and historically anticipated late payments — is estimated at 96.2%, up from 95.6% in August.
The year-to-date average full-payment rate through July stands at 95.8%, placing 2026 slightly below the 2025 full-year average of 96.0%, but above the 2024 average of 95.3%.
Overall, full-payment performance remains comparatively stable. The September forecast suggests that a large share of missed on-time payments are still ultimately being cured, helping preserve income realization for independent landlords even as payment timing remains less favorable than in earlier years.
Late Payments
Late payments remain a meaningful source of pressure for the mom-and-pop rental sector. While generally less damaging than outright nonpayment, delayed rent can still create significant operational challenges for independent landlords that rely heavily on timely collections to meet recurring expenses.
Late-payment activity rose sharply through 2025 and reached a post-pandemic high of 13.5% in January and February 2026. Conditions improved through the spring, falling to 12.1% in May, before moving back up to 12.4% in June and 12.6% in July.
Some of the recent increase appears consistent with seasonal patterns, as late payments have historically moved higher during the summer months. Even so, the current level remains historically elevated. Rates above 10% were relatively uncommon before 2025, suggesting that payment timing continues to reflect meaningful financial strain among renter households.
Performance by Property Type
Performance improved across all three major rental subsectors in September, with multifamily again posting the strongest monthly gain.
The multifamily on-time payment rate increased from 82.1% in August to 82.8% in September, a 70-basis-point improvement. Single-family rentals increased from 82.8% to 83.1%, while 2–4-family rentals rose from 83.1% to 83.4%.
The latest data continue to narrow the gap between multifamily and smaller rental formats. Since July, multifamily on-time payments have increased by roughly 160 basis points, compared with more modest gains in single-family and 2–4-family properties. Multifamily remains the weakest-performing segment, but its recovery has become an increasingly important contributor to the national improvement.
Regional Differences
State-level performance remained uneven in September, though Western and Mountain states continued to dominate the upper end of the distribution.
Alaska posted the highest on-time payment rate nationally at 93.3%, followed by Wyoming (93.0%), Utah (92.7%), New Hampshire (90.9%), and Nevada (90.0%). At the lower end, Mississippi recorded the weakest on-time payment rate at 69.4%, followed by Delaware (71.8%), West Virginia (76.7%), Michigan (78.1%), and Alabama (79.0%).
Individual state readings can move significantly from month to month, so the broader regional pattern remains more informative than short-term changes in any one market. Western and Mountain states continue to outperform, while weaker collection performance remains more concentrated across parts of the South and Midwest.
Importance of the Independent Landlord Rental Performance Report
The Independent Landlord Rental Performance Report provides insights into how well non-institutional landlords are managing rental payments. It uses data from property management software RentRedi, showcasing results from 60,014 units. Information is collected and reported monthly by Chandan Economics. The trends highlighted here can serve as a benchmark for investors, brokers, and policymakers seeking to understand the health of independent landlords in the rental market.
Source: Chandan Economics













 Accessibility